The results section is what all your readers look forward to when they browse your paper. This is where they will finally find the answers to the questions that motivated the research. Are the hypotheses formulated in the introduction confirmed? Is the theory valid? If your article were a crime movie, the results section would be the scene where the murderer is discovered. So, better to make it captivating!
If you are currently writing or plan to write an empirical article soon, this post is for you. You will find 6 tips to make your results section a fine work of writing, worthy of a novel by Agatha Christie (you will find more information on the general structure of scientific articles here, the introduction here, and the method section here).

Think about how you read scientific articles. Chances are that most of the time you don’t read them from cover to cover, paying attention to every word and every idea, or thinking intensely about what the author might have meant. You probably start by going through the abstract, then you read the first two sentences of the introduction, and then you go straight to the results. Time is too precious and there are too many scientific publications to dwell on every one of them.
The readers of your article are in the same situation. They want to quickly understand the research you’ve done and the results you’ve found. Your job is to make it easy for them. Here’s how you can do it.
1. Carefully select the results you wish to present
If you have spent days, weeks, months analyzing your data; if the pile of statistical outputs on your desk is higher than the Statue of Liberty that carries the Eifel Tower to the top of Mount Everest: Congratulations! Scientists need to know their data in every detail. You have done an excellent job and you can be proud of it. Having said that, what I am about to tell you may hurt: 95% of these results have no place in your article.
I’m not advising you here to hide a result that doesn’t suit you. At no cost! Honesty and transparency are at the heart of all good science. My dearest wish – besides a new season of the Kominsky Method – is that you, all of us, produce excellent science. To achieve this, it is essential to acknowledge that some results are unexpected or do not confirm our hypotheses. This is the only way to learn from our research results and improve our theories. So be honest and transparent!
What I’m saying here is that the results you present in your paper must be consistent with the research question you announced in your introduction. This research question is the main thread of your article. Does a result help to shed light on your research question? If the answer is a resounding “yes”, you should most likely report it in your results section. If the answer to this question is “no” or “not really”, it may be best to omit it or save it for another article. Presenting results that do not really match your research question is confusing for the reader and detracts from the clarity of your article.
Let’s take an example!
Imagine that you have conducted a study to test the efficacy of a new treatment to cure a disease called dragon-pox (yes, this is the same example as in the post on the introduction, I’m trying to be consistent here!). Your main research question is: “Is the new treatment more effective in curing dragon-pox than the old one?” Now imagine that while conducting this research, you discovered that patients who smoke cigarettes are more likely to develop severe forms of dragon-pox. This result is interesting in itself, but it has nothing to do with your research question. Therefore, you probably shouldn’t report it in your paper. Rather, you can publish it in another article, in which you might want to confirm this exploratory finding with a new confirmatory study. William Faulkner said, “In writing, you must kill all your darlings.” The same goes for scientists and their significant unexpected results.
2. Start with the most important findings
In a research article, it is rare to have only one result. Typically, an article reports a series of results. How do you determine the order in which to present these results?
Not all results are essential. Some answer the research question directly while others are more peripheral. Start with your most important results and then present the secondary ones. If you are testing the efficacy of a treatment, the most direct evidence of efficacy should come first, followed by potential moderators, mediators, and outcomes that are less relevant to the research question.

Here is an example:
Main finding: “Dragonpox patients who received treatment A recovered in half the time it took patients who received treatment B. Indeed, one week after treatment A, 76.54% of patients were symptom-free and were able to resume their daily activity compared to 36.63% with treatment B.”
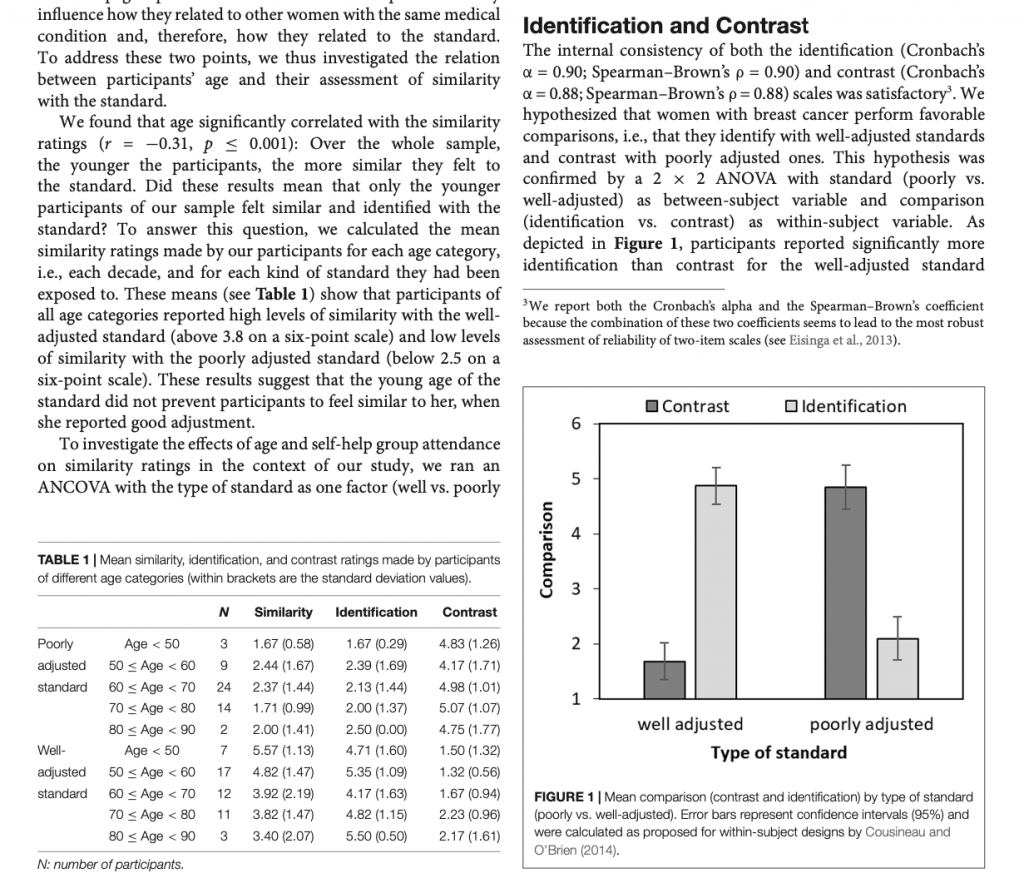
Peripheral finding: “In addition, we found that treatment A was more effective in women than in men. A 2 x 2 ANOVA with treatment and gender as between-subject factors revealed a significant interaction (see Table 1). Post-hoc analyses indicated that, after treatment A, women recovered more quickly than men, but we did not find any gender difference in response to treatment B”.
3. Explain the meaning of your results and how they support your hypotheses and conclusions
Statistical results without any explanation are as exciting as a pasta meal without sauce: It’s tasteless and hard to swallow. The results section of an article is more than the output of a series of statistical tests. It is part of a story. So, to make your article easy to understand and interesting, it is important to embed the results into the larger story of your paper. How can you do this?
Begin the paragraph reporting a specific result by reminding the reader why you performed this analysis, then describe the results of that analysis, and finally end with an interpretation of those results. You don’t need to follow this structure for every result; it would probably be too cumbersome. Just do it for your main results and you will be sure that your readers will have a good grasp of your story.
Isn’t the interpretation of the results reserved for discussion? Yes and no. Saying that a statistical test is significant is already an interpretation. After all, a significance level is a subjective judgment. Writing that one treatment is more effective than another is also an interpretation of a difference in numbers.So you will certainly provide some kind of interpretation in the results section. To find out how far you need to go, check the articles published in the journal in which you intend to submit your study. The degree of interpretation in the results section, indeed, varies from one area of research to another and from one journal to another.
4. Place as much information as possible in the tables and figures
There are two ways to present scientific results. Either you insert them in the text in which you describe them, or you present them in the form of tables and figures. If you have a choice, choose the second option. Statistical results inserted into a text are difficult to grasp and make the text more difficult to read. Your readers will have a smoother experience if the text and the statistics are presented separately.
5. Use subheadings
Subheadings contribute to the clarity of your paper and results for several reasons:
- They attract the attention of readers (they are often the only thing you read in a newspaper).
- They help your readers understand the structure of your results at a glance.
- They help your readers quickly scroll through the article to get to the results they are most interested in.
Don’t be afraid to use subheadings to improve the clarity of your result section.
6. Don’t get distracted by statistics
Many scientists are passionate about statistics. Analyzing data is an art, which requires work, intelligence, and expertise. Still, statistics, however brilliant and innovative they may be, are only a means to an end. The main characters of an article are not the statistical analyses (unless it is a methodological article) but the data. When statistics steal the spotlight from the data, the article loses clarity and power.
Thus, describe and report as much information about your statistical analyses as is necessary for the reader to understand what you have done, but remember that the focus should be on the results, not the analyses.
I wish you good luck in writing your result section!
Cover photo by Isaac Smith on Unsplash; Photo by William Iven on Unsplash; photo by Pixabay from Pexels
Pingback: How to structure your scientific paper (Part 5: The discussion) - A Brilliant Mind
Pingback: How to write the introduction of your scientific paper